You publish a post on X, watch the impressions climb, then open analytics and see almost no link clicks. The post may have reached the right kind of people, but the promise wasn't clear enough, the visual didn't earn attention, or the link appeared at the wrong moment.
Impression click-through rate gives you a clean starting point: clicks divided by impressions, multiplied by 100. Social CTRs usually sit in the low single digits. A 2026 benchmark lists Facebook at 0.90%, Instagram at 0.68%, LinkedIn at 0.52%, and X promoted posts at 0.86% for the period from Q4 2024 through Q4 2025, according to Focus Digital's social media advertising CTR benchmarks.
That baseline changes how you judge performance. You're not trying to turn every post into a flood of clicks overnight. You're diagnosing a system made of hook, visual, CTA placement, audience, and timing, then improving one part at a time.
Table of Contents
Why Your Impressions Are Not Turning Into Clicks
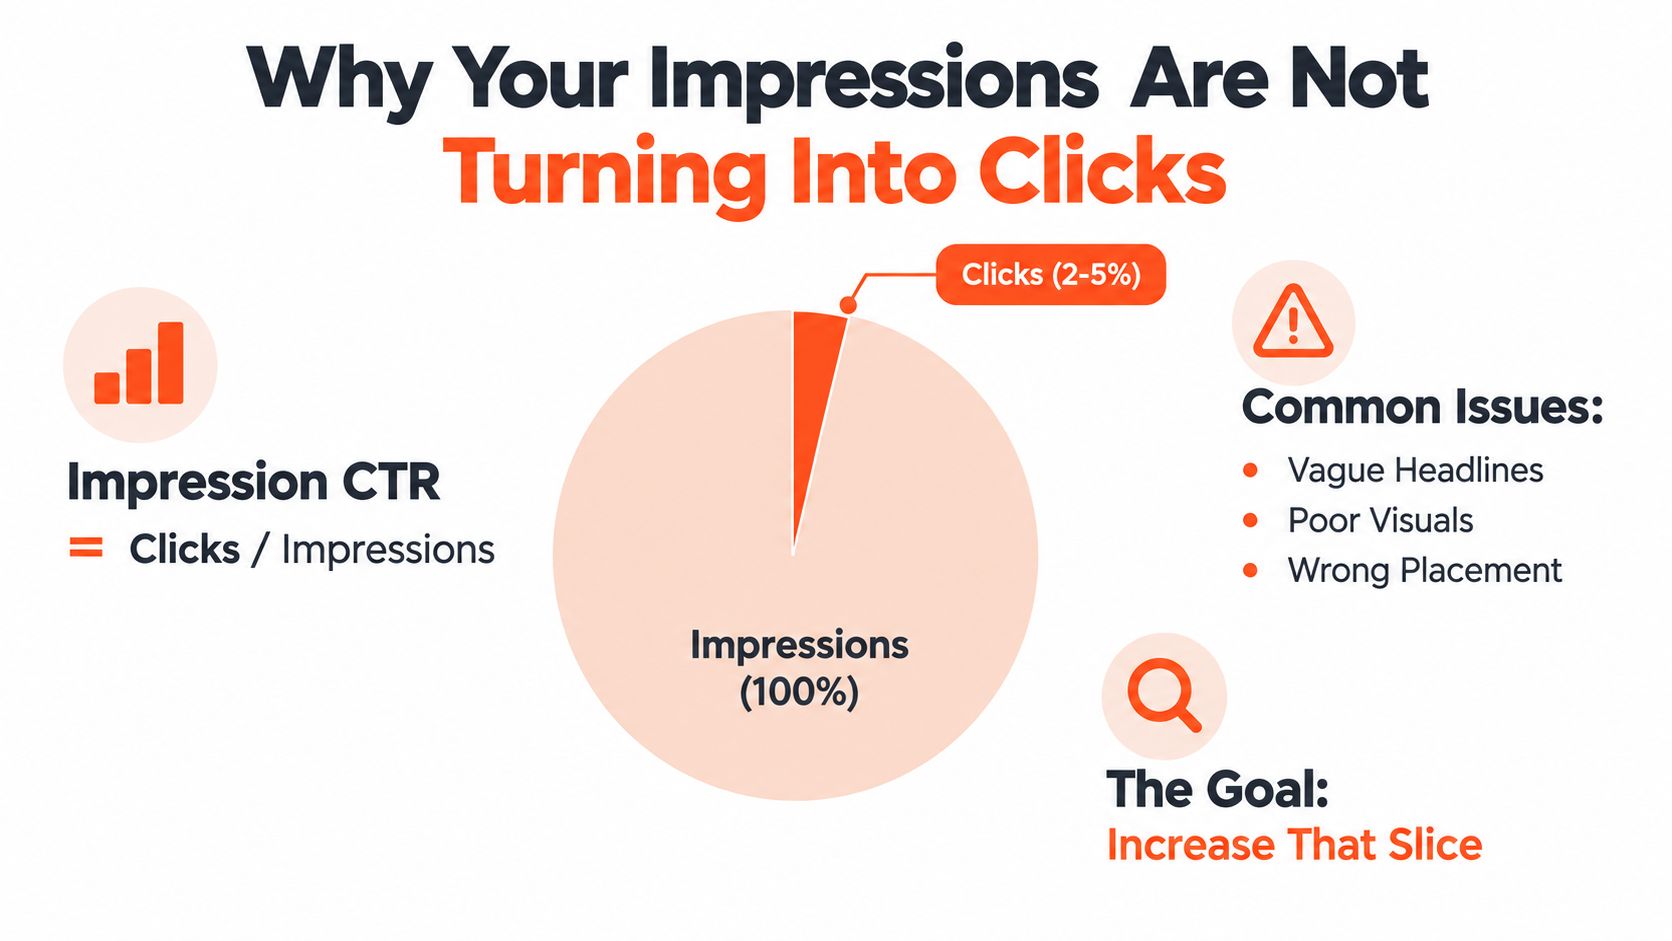
A post can earn plenty of visibility and still fail to create intent. Suppose your X post reaches a broad audience with a generic line such as “Our latest guide is live.” People may recognize the topic, but they don't know what they'll gain by clicking. The impression happened. The value proposition didn't.
CTR is calculated as clicks divided by impressions, multiplied by 100. That denominator matters because a small number of clicks can look disappointing beside a large impression count, even when the rate is normal. The ViewsMax guide to YouTube CTR is useful background because it treats the metric as a packaging signal. Your title, thumbnail, or post framing earns the initial choice, while the content has to justify it afterward.
Diagnose the broken part first
Start with three questions:
Creative: Does the first line state a specific problem, audience, or outcome?
Audience: Are impressions coming from people who need the offer, or from a broad audience attracted by a general topic?
Placement: Can someone see the link and understand why it belongs there without searching through replies?
A useful example is a founder promoting a landing-page teardown. “I analyzed landing pages today” creates curiosity but little direction. “Three landing-page sections are costing SaaS founders qualified demos” gives the reader a problem, a defined audience, and a reason to continue.
You can also compare your post against your broader understanding of what impressions mean on social media. If impressions are weak, fix distribution first. If impressions are healthy but clicks are weak, inspect the promise and placement. If clicks are healthy but visitors leave immediately, the problem may be a mismatch between the post and the destination.
Practical rule: Don't rewrite the hook until you've confirmed that the people seeing it could plausibly want the destination.
Small absolute gains matter at low baselines. Focus Digital notes that Facebook moved from 0.88% in 2024 to 0.90% in 2025, a 2.3% relative increase, showing why consistent improvement can be meaningful even when the visible percentage barely moves. Treat your current CTR as a diagnostic baseline, not a verdict on your content.
How X Measures Clicks Engagement and What to Track
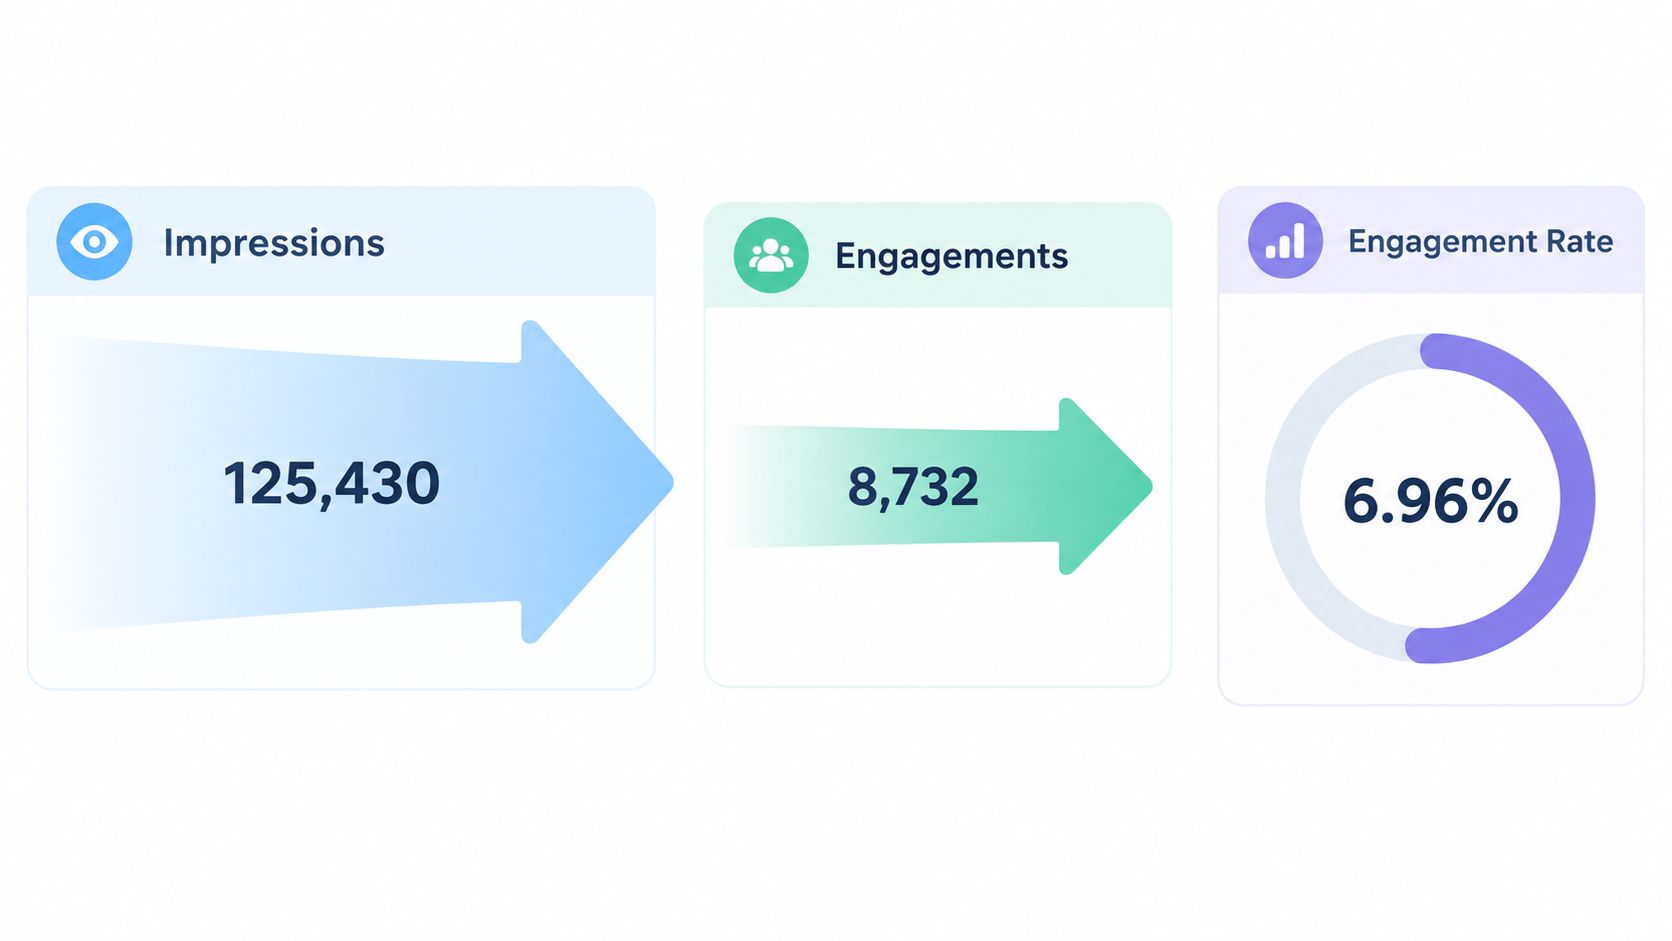
X analytics becomes useful when you stop treating impressions as the final score. X defines engagement rate as engagements divided by impressions, and its dashboard includes likes, replies, follows, hashtag clicks, and impressions, alongside other interactions, as documented in the X Tweet Activity Dashboard.
That means two posts with the same impression count can have completely different business value. One might collect passive views. The other might generate link clicks, replies from relevant buyers, and profile follows. The second post has created more action from the same distribution opportunity.
Build a simple post-level record
For every link post, record:
Impressions, the number of times the post was shown.
Link clicks, the numerator for impression CTR.
Engagements, including replies, likes, follows, and other interactions.
Engagement rate, engagements divided by impressions.
Downstream behavior, such as sign-ups, completed reads, replies, or purchases when you can measure them.
CTR is clicks divided by impressions, multiplied by 100. Engagement rate uses the same denominator but a wider numerator. Keeping both prevents a common mistake, optimizing for clicks that don't produce meaningful activity after the click.
A post can have a lower CTR and still deserve another test if it creates strong replies from your target customers. Conversely, a post can win the click comparison while attracting people who bounce because the destination doesn't match the promise. The LinkedIn analytics tools guide from ViralBrain offers a useful reminder that platform analytics often needs supporting tools and structured comparisons, not occasional glances at a dashboard.
Separate reach from relevance
Don't celebrate impressions in isolation. Ask whether the post reached the audience you intended and whether the interaction mix supports your goal. A founder seeking product demos should value qualified replies and site actions differently from a creator seeking discussion.
For a broader framework, use this guide to X growth metrics serious creators should track. The key habit is simple: compare posts on actions per impression, then inspect the quality of those actions before choosing a winner.
Hooks Visuals and Copy That Earn the Click
Most weak hooks fail because they ask the reader to infer the benefit. “Ten tips for better marketing” names a category, but it doesn't identify the problem, the audience, or the payoff. A stronger version might be, “Three image changes that make a B2B post easier to understand before anyone reads the caption.” It gives the reader a concrete object, a clear context, and a reason to investigate.
Chartbeat reported that image testing produced a 38% lift in CTR and a 37% lift in quality clicks when a winning variation was selected. Its research also found that changing images and headlines together generated a 247% higher engagement lift than changing headlines alone. Those findings appear in Chartbeat's image-testing research, and they support a practical conclusion: visuals deserve their own testing lane.

Turn vague promises into visible outcomes
Use this rewrite pattern:
Audience + problem + specific promise + next step
Weak: “Our new productivity guide is here.”
Stronger: “For founders losing their mornings to scattered tasks, this guide turns one messy backlog into a workable weekly plan.”
The second version doesn't need hype. It tells the reader who it's for, what friction it addresses, and what the click leads toward. Concrete headlines tend to outperform vague ones when the original copy doesn't make the value obvious. A 2024 Nature pilot dataset reported an average headline clickthrough rate of 1.33% and a median of 1.04%, while related experimental literature found that curiosity-gap framing can backfire when it becomes too abstract. See the Nature study on headline concreteness and selection behavior.
Curiosity is useful only when the reader can quickly understand the subject. “You won't believe what changed” hides the topic. “The checkout-field change that removed a major source of hesitation” creates intrigue without withholding the category.
Test the visual as part of the promise
For one post, keep the copy constant and create visual variations such as:
Annotated screenshot: Highlight the exact dashboard, sentence, or interface element the reader will see.
Outcome graphic: Show the before and after state without stuffing the image with text.
Human proof: Use a founder, customer, or creator image when the person adds context rather than decoration.
Simple contrast: Use one subject, one focal point, and enough empty space for mobile viewing.
Changing the image and headline at the same time may create a larger lift, but it makes the learning less precise. If you're building a repeatable system, isolate the hook first, then the visual, then the CTA. The guide to writing stronger hooks can help you build the first variable before you start designing alternatives.
Keep a ten-minute pre-publish check:
Can a stranger identify the audience?
Is the promise concrete?
Does the visual reinforce the same idea?
Does the link deliver exactly what the hook suggests?
Would the post still make sense without the image?
The best-performing hook isn't necessarily the loudest. It's the one that reduces interpretation time and makes the next action feel obvious.
Where to Place Your Link and Call to Action for Maximum Clicks
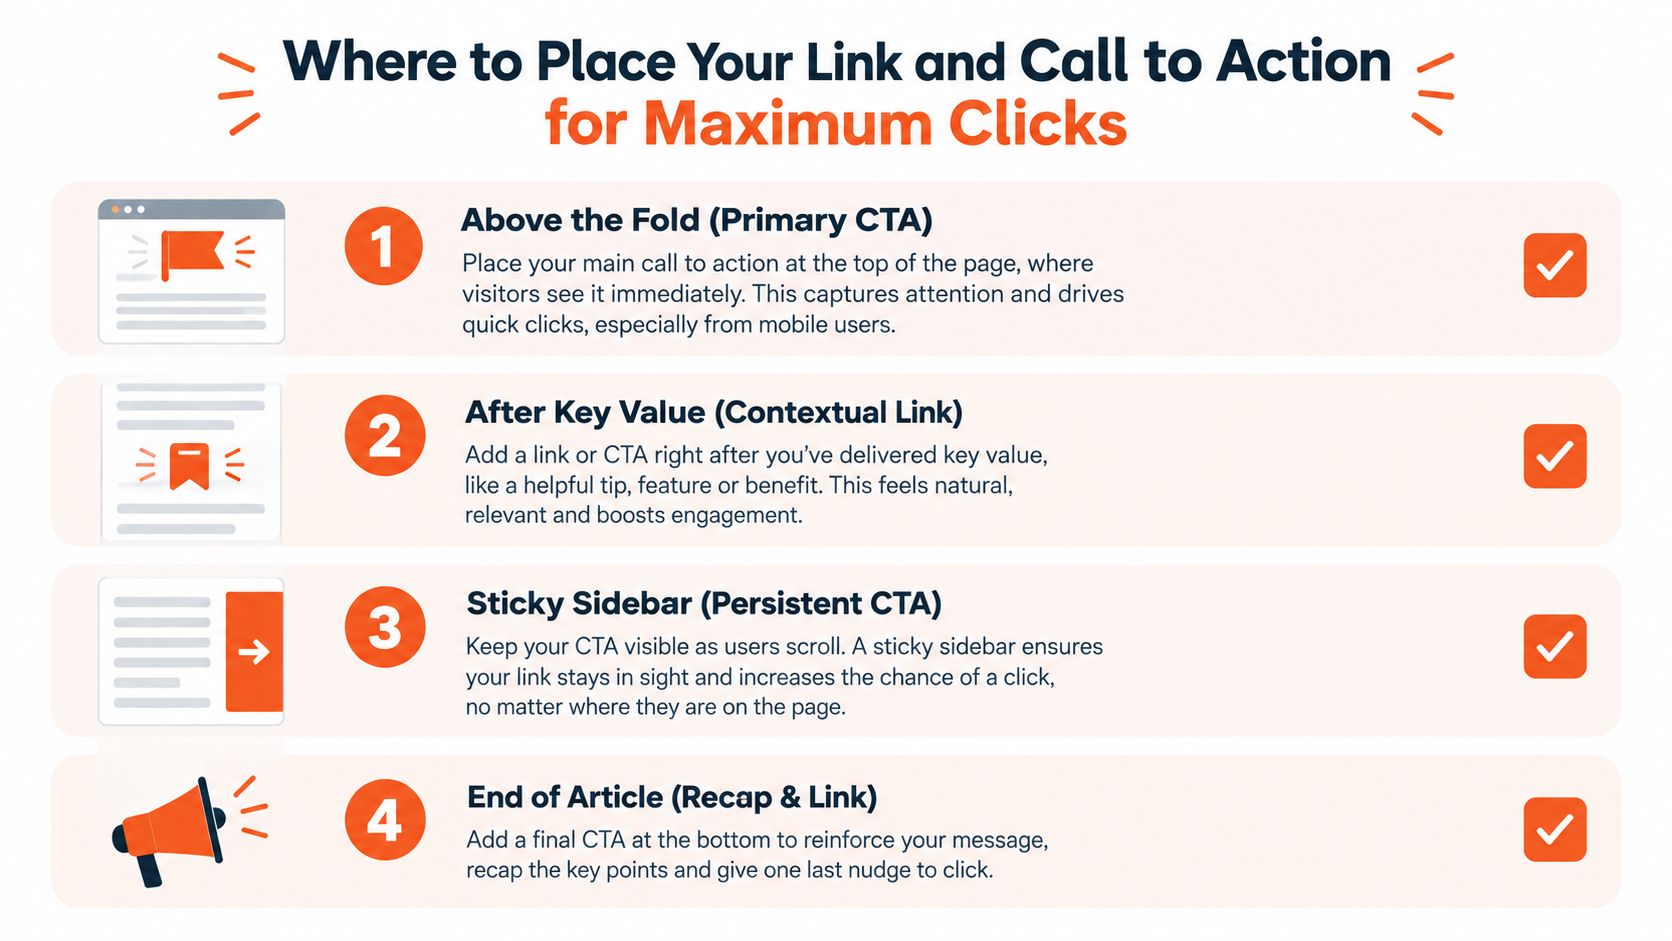
A founder shares a useful teardown, yet the post earns impressions without visits. The link appears at the end, after several ideas, so readers must reconstruct the promised next step. Placement is part of the conversion system: hook, visual, CTA, audience, and timing must point toward the same action.
Test the main post against a link in the replies. The Link Spot's X CTR benchmark discussion notes that reply links can outperform links in original posts in some contexts, while its benchmarks place organic post CTR generally around 0.5% to 1.5% and ad CTR around 1% to 3%. Treat those figures as directional. Your own analytics should decide whether immediate traffic or deeper conversation matters more.
Choose the location that fits the post
A single-post offer should make the action visible after the core promise. Keep the CTA specific and low friction:
“See the full teardown and copy the checklist.”
“Read the five-minute guide before your next launch.”
“Use the template to audit your page today.”
For an educational thread, give readers a useful argument first, then add the link in a reply. The destination feels like the next layer of the lesson instead of an interruption. If traffic matters more than conversation depth, test the same thread with the link in the original post.
A postscript keeps the body clean: “P.S. The complete worksheet is here.” Replace “here” with the asset and its use, so readers know what they will receive before clicking.
Keep one clear path
Several destinations split attention and make attribution harder. Give each post one primary action, then ensure the landing page delivers exactly what the hook promises. If the hook says “audit your pricing page,” a generic homepage creates a mismatch no CTA can repair.
Visual CTAs work only when the graphic remains legible on mobile and adds context. “Download the guide” alone says little if the caption has not established the problem or outcome. For wording patterns, use this guide to write a Twitter call to action, then test phrasing separately from placement.
Fix the post when readers engage but hesitate at the action. Fix distribution when the post attracts the wrong audience. Fix placement when the right readers respond, yet the link is buried or disconnected from the promise.
Put the link where the reader has received enough value to want the next layer, not where the post has run out of space.
Timing Audience Targeting and Frequency That Protects Reach
A strong hook can still produce weak CTR when it reaches inactive or poorly matched readers. Distribution affects every other lever: audience fit, posting window, spacing, and whether the post earns enough early interaction to continue circulating.
Posting more often does not guarantee more clicks. Recent X benchmark coverage reports that total impressions per post fell 5% year over year to about 2,711.39, while another analysis associates overly frequent posting with a 30% to 45% drop in per-post impressions when spacing falls below 90 minutes. These figures come from Metricool's X statistics and SocialRails' social media benchmarks guide. Use them as directional evidence, not as a universal posting rule.
Match timing to intent
Schedule a high-intent link post during an active audience window, then give it room to collect replies and clicks before publishing another major post. Use non-promotional updates between offers when they provide context, proof, or conversation. Fast-moving discussions usually work better as replies than as a stream of disconnected original posts.
A creator targeting founders could publish a product teardown, spend the next window replying to relevant launch discussions, and share a short lesson later. That sequence creates more discovery opportunities without asking every post to compete for immediate attention.
Your audience's activity pattern matters more than a generic “best time.” A post that needs considered action may perform better when readers have time to follow the link, while a quick observation can fit a busier conversation window.
Show the post to people likely to act
Broad distribution can raise impressions while leaving CTR unchanged. A narrower audience may see fewer posts but respond more often when the hook names a specific role, pain point, or use case. Search active conversations, record the language people use, and build the hook around that problem rather than your product category.
SupaBird combines a content calendar, engagement discovery, and AI-assisted drafting. Its calendar supports scheduling around audience windows in cities such as Berlin, New York, London, and Mumbai. Its Engage module surfaces conversations where a relevant reply may outperform another broadcast post.
Run the same post against three conditions: existing followers, a narrow interest group, and an audience reached through relevant replies. If CTR improves only in the narrow segment, adjust targeting before rewriting the hook or visual. If the right audience responds but clicks remain weak, review the link placement and CTA. If every segment ignores the post, fix the creative first.
A Simple A/B Testing System to Lift CTR Week After Week
A useful test answers one question. If the hook, visual, audience, link position, and posting time all change, the winning post reveals little about the reason it worked.
Set a control before publishing. Keep the audience, destination, and timing as consistent as possible, then change one variable. The headline experiment research from the University of Chicago supports comparing alternative headlines within the same package, using impressions as the denominator, and checking post-click behavior instead of treating CTR as the final result.
Start with a hypothesis tied to the system:
A problem-led hook may beat a feature-led hook.
An annotated screenshot may beat a talking-head image.
A link in the original post may outperform a link in the first reply.
A direct CTA may earn more action than a curiosity-led CTA.
Keep the destination identical. Log the date, audience, placement, impressions for each variant, clicks, CTR, replies, follows, and meaningful downstream actions. A higher CTR is not a durable win if visitors leave immediately or fail to take the intended next action.
Variable Tested | Variant A vs Variant B | Impressions per Variant | CTR and Next Action |
|---|---|---|---|
Hook | Feature announcement vs problem-led promise | Record each variant separately | Compare CTR and quality actions, then retain the clearer promise if downstream behavior holds |
Visual | Product screenshot vs annotated screenshot | Record each variant separately | Keep the image that earns stronger clicks without reducing relevant engagement |
CTA placement | Original post link vs first-reply link | Record each variant separately | Repeat the stronger placement with a closely related post |
Audience | Broad topic audience vs defined role-based audience | Record each variant separately | Narrow targeting if intent improves, even when total reach is lower |
A spike can mislead. A timely post, a reply from a large account, or a curiosity-heavy framing may inflate clicks without creating useful visits. Repeat the comparison with a related post, then inspect whether people read, sign up, reply, or follow.
Run a small number of controlled experiments each week. Archive the variants beside the lesson, such as “specific audience plus annotated visual earned more qualified replies.” That record is more useful than isolated percentage changes because it connects the creative choice to audience quality and post-click behavior.
Your Next Moves to Turn More Impressions Into Clicks
Your next improvement probably isn't “write better posts.” It's identifying the first broken handoff.
If impressions are low, inspect audience and timing. If impressions are healthy but clicks are weak, rewrite the hook and make the visual communicate one concrete promise. If people engage but don't click, test CTA language and link placement. If clicks arrive but downstream actions are poor, repair the match between the post and the destination.
Run a focused seven-day sprint:
Choose one high-impression post with weak click performance.
Write a specific audience and problem-led hook.
Create one visual variation.
Test the link in the original post against the first reply.
Keep the audience and timing as consistent as possible.
Log impressions, clicks, CTR, engagement rate, replies, follows, and downstream behavior.
Reuse the winning principle in the next related post.
Don't optimize every variable at once. A clear test teaches you what to repeat, while a chaotic rewrite only gives you another result to explain.
SupaBird's Ideas Lab can generate post angles, X-GPT can reshape drafts into tested formats, and X Coach can help diagnose why a post underperformed. Use those tools as iteration support, but keep the editorial judgment yours. The objective is simple: make the next post easier to understand, easier to trust, and easier to click.
Use SupaBird to organize ideas, identify relevant conversations, schedule around audience activity, and review why individual X posts performed well or poorly. Start with one CTR test this week, then let the resulting evidence guide your next hook, visual, CTA, and publishing window.

How Often Should You Tweet for Maximum Growth?

What Should Your First 10 Tweets Be About?

How to Run X for Ten Clients: The Agency Workflow

How to write a bio that gets people to follow you

Digital Product Launch Strategy

Best Twitter Growth Service for Creators in 2026
From X to Every Platform: Repurpose Without Flopping

How to Get Cited by Grok: Winning X’s AI Search in 2026

5 X (Twitter) Growth Metrics Every Serious Creator Should Track — and How to Get the Data